Buy Products here
Thursday, October 16, 2014
Single phase and Three phase formula's used in electrical engineering
Electrical
Formulas
Sunday, October 12, 2014
Comparison between Three Phase Overhead and Underground cables
🔌 Power Transmission: Overhead vs Underground
Cables
⚡ Key Electrical Aspect
·
Overhead Lines (OHTL):
Inductance is predominant.
·
Underground Cables (UGC):
Capacitance is predominant.
✅ Advantages of Overhead Transmission Lines
1. Lower
Conductor Cost:
o
Overhead conductors run cooler in open air →
smaller cross-section needed compared to underground.
o
Results in cheaper conductor material.
2. Cheaper
Insulation:
o
OHTL uses bare conductors, spaced by air (a
natural insulator).
o
UGC requires costly insulation: paper tapes,
metal sheath, oil/gas filling, storage vessels.
3. Lower
Installation Cost:
o
Poles/towers are cheaper to install than
trenching and laying underground cables.
4. Easy
Capacity Addition:
o
OHTL can be upgraded (adding more circuits or
reconductoring) faster and at lower cost.
✅ Advantages of Underground Transmission Cables
1. Public
Safety:
o
No risk of electrocution from exposed
conductors.
o
Less chance of accidental contact.
2. No
Interference & Better Aesthetics:
o
No electromagnetic interference to nearby
communication lines.
o
Cityscape remains uncluttered → better
appearance in urban areas.
📊 Comparative Snapshot
|
Feature |
Overhead Lines
(OHTL) |
Underground
Cables (UGC) |
|
Electrical Property |
Inductance predominant |
Capacitance predominant |
|
Conductor Cost |
Lower |
Higher |
|
Insulation Requirement |
Minimal (air insulation) |
Complex (paper, oil, sheath, vessels) |
|
Installation Cost |
Lower |
Very high |
|
Capacity Upgradation |
Easy |
Difficult |
|
Public Safety |
Exposed conductors, safety concern |
Safer (no exposure) |
|
Interference |
May interfere with nearby comm. lines |
No interference |
|
Aesthetics |
Visible structures, cluttered look |
Hidden, better appearance |
|
Aspect |
Overhead (OHTL) |
Underground (UGC) |
|
Initial
Cost |
Baseline—e.g.,
~$285k/mile (69 kV) |
Approximately
3× to 14×, typically ~5× or 4.5× higher |
|
Reliability |
Vulnerable
to weather, vegetation, etc. |
Highly
reliable—e.g., 95% SAIDI improvement, 4% outage vs 24% |
|
Maintenance
& Repairs |
Quick
repairs, lower cost |
Slower,
more expensive maintenance |
|
Lifetime
Costs |
Lower
overall |
Higher—12–28%
more in distribution; 2–4× for transmission |
|
Urban
Use Case |
Less preferred—visible
infrastructure |
Preferred—saves
₹500 cr/year in Hyderabad example |
|
Real-World
Costs |
~$40
m/15 km UK, or AU$700M+ |
~$330
m/15 km UK; AU$2–4.5 b; DKK 30M/km in Denmark |
Saturday, October 11, 2014
Skin Effect Three phase lines; Factors effecting skin effect; Why skin effect not occur on DC?
Skin Effect in Transmission Lines: Meaning, Causes & Factors
What is Skin Effect?
Skin effect is a phenomenon that occurs in transmission lines carrying alternating current (AC), where the current is not uniformly distributed across the entire cross-section of the conductor. Instead, the current density is higher near the surface (or skin) of the conductor and much lower at the core.
In contrast, direct current (DC) flows uniformly throughout the cross-section of the conductor, hence skin effect does not occur in DC systems.
This uneven distribution of AC leads to an increase in effective resistance of the conductor compared to DC.
Why Does Skin Effect Occur in AC?
The root cause of skin effect lies in the electromagnetic flux linkages created by alternating current:
-
The inner filaments of the conductor produce flux that links with both inner and outer filaments.
-
The outer filaments, however, only produce flux that links with themselves.
-
This means flux linkage is higher for inner filaments, resulting in higher inductive reactance at the core compared to the surface.
-
Since current always prefers a path of lower opposition (impedance), it shifts towards the surface of the conductor.
Thus, most of the AC flows along the outer periphery, giving rise to the skin effect.
Mathematical Understanding (Simplified)
Imagine splitting a solid conductor into n annular filaments:
-
If the total current is I, then each filament carries a small current i, where:
-
The inner filaments experience flux from the whole cross-section → higher reactance.
-
The outer filaments experience less flux linkage → lower reactance.
This imbalance in reactance distribution pushes current outward to the conductor surface.
Factors Affecting Skin Effect in Transmission Lines
The intensity of skin effect in AC conductors depends on several parameters:
1. Frequency of Operation
-
Skin effect increases with frequency.
-
At 50 Hz (standard power frequency), it is noticeable but not dominant.
-
At higher frequencies (radio, microwave), the effect is very significant.
2. Diameter of Conductor
-
Larger diameters cause more pronounced skin effect.
-
This is why hollow conductors are often used at high voltage AC lines.
3. Shape of Conductor
-
Conductors with irregular or stranded shapes (like stranded conductors) reduce the skin effect compared to solid conductors.
4. Material of Conductor
-
Conductors with higher permeability (like iron) exhibit more skin effect.
-
Materials like copper and aluminum (low permeability) are preferred for transmission lines.
Practical Implications of Skin Effect
-
Increases effective resistance of conductors in AC systems.
-
Increases power losses in transmission lines.
-
Engineers often use stranded conductors (like ACSR – Aluminum Conductor Steel Reinforced) to minimize this issue.
-
At very high frequencies, hollow tubes are preferred since current only flows on the surface anyway.
FAQs on Skin Effect
Q1: Why does skin effect not occur in DC?
In DC, current is steady and does not produce alternating flux. Thus, the current distribution remains uniform across the conductor cross-section.
Q2: Does skin effect depend on voltage?
No, skin effect depends on frequency and conductor properties, not on the voltage level directly.
Q3: How can skin effect be minimized?
-
Use stranded conductors (like ACSR).
-
Use hollow conductors for high-frequency applications.
-
Operate at lower frequencies where possible.
Q4: Why is skin effect important in power transmission?
Skin effect increases the effective resistance of conductors, which means higher I²R losses and reduced efficiency of power transmission.
Final Thoughts
The skin effect in transmission lines is a critical phenomenon in electrical engineering, especially for AC power transmission. Understanding its causes, effects, and mitigation methods helps in designing efficient transmission systems and minimizing power losses.
Monday, October 6, 2014
Corona Loss in Transmission Lines; Hissing sound in transmission lines
⚡ Corona Effect in Transmission Lines
🔹 Introduction
In high-voltage transmission lines, the surrounding air acts as a dielectric medium. When the electric field intensity around conductors exceeds a certain critical value, it ionizes the surrounding air molecules. This ionization leads to partial discharge of electricity, accompanied by bluish glow, hissing noise, and ozone production.
This phenomenon is known as the Corona Effect.
🔹 Mechanism of Corona Formation
-
Free electrons are always present in air (from cosmic rays, UV radiation, radioactivity).
-
As voltage increases → electric field gradient at conductor surface increases.
-
Electrons accelerate → collide with neutral air molecules → release more electrons.
-
This leads to an electron avalanche → ionization of surrounding air.
-
Discharge appears as faint luminous glow + hissing sound.
👉 If conductor spacing is too small (spacing-to-radius ratio < 15), flashover occurs before corona starts.
🔹 Visual & Audible Symptoms
-
Visual glow: Bluish, violet, or faint luminous glow around conductors at night.
-
Audible noise: Crackling or hissing, louder in rainy/stormy weather.
-
Ozone smell: Due to O₂ dissociation forming O₃.
-
Energy loss: Appears as Corona Loss.
🔹 Corona Loss (Power Dissipation)
The corona loss (empirical Peek’s formula) is:
Where:
-
= frequency (Hz)
-
= conductor radius (cm)
-
= spacing between conductors (cm)
-
= phase-to-neutral RMS voltage (kV)
-
= critical disruptive voltage (kV)
-
= air density correction factor
with (at NTP).
👉 Key takeaways:
-
Corona loss ∝ → increases sharply above disruptive voltage.
-
Larger conductor diameter reduces corona.
-
Higher spacing also reduces corona effect (up to a limit).
🔹 Factors Affecting Corona
1. Conductor Parameters
-
Diameter: Larger → lower electric field → reduced corona.
-
Surface condition: Polished/smooth → higher disruptive voltage; rough/dirty → more corona.
-
Bundled conductors: Used in EHV lines (400 kV, 765 kV) to reduce corona.
2. Line Voltage
-
Below 30 kV → negligible corona.
-
110 kV – 220 kV → corona starts appearing.
-
400 kV → severe corona → special design needed.
3. Spacing Between Conductors
-
Small spacing → flashover risk.
-
Very large spacing → weak field, corona less likely.
-
Optimized spacing balances mechanical & electrical design.
4. Atmospheric Conditions
-
Humidity & Rain: Increases corona (more free ions).
-
Pressure: At higher altitudes (lower air density), corona appears at lower voltages.
-
Temperature: Higher temperature reduces air density → easier ionization.
🔹 Effects of Corona on Transmission Lines
✅ Advantages
-
Acts as a safety valve: reduces steepness of lightning surges.
-
Provides some protective cushioning for insulation.
❌ Disadvantages
-
Power Losses: Continuous energy dissipation as corona loss.
-
Noise Pollution: Hissing/crackling in EHV lines.
-
Interference: Causes radio/television disturbances.
-
Material Degradation: Ozone produced corrodes nearby insulators & conductors.
-
Voltage Regulation Issues: Loss increases with voltage, affecting efficiency.
🔹 Practical Engineering Solutions to Reduce Corona
-
Increase conductor diameter
-
Use hollow conductors or ACSR (Aluminium Conductor Steel Reinforced) for strength & larger radius.
-
-
Bundled Conductors
-
Common in 400 kV, 765 kV lines: splitting one phase into 2–4 sub-conductors → reduces field intensity.
-
-
Smooth conductor surface
-
Prevents dirt, dust, and corrosion which increase corona.
-
-
Optimized spacing
-
Proper phase-to-phase spacing minimizes losses without causing flashover.
-
-
Weather considerations
-
Lines in humid/polluted regions designed with extra margins for corona inception voltage.
-
🔹 Real-World Example
-
400 kV Single Circuit Line (India):
-
Uses quad-bundled conductors to minimize corona.
-
If single conductor were used, corona loss could reach 50–100 kW/km/phase in wet conditions.
-
With bundled conductors, loss reduces to <10 kW/km/phase.
Key Insights into Corona Phenomenon
1. Why the Violet Glow?
-
The glow arises from ionized nitrogen molecules emitting photons as they return to a lower energy state—primarily in the blue-violet and ultraviolet spectra WikipediaEEP - Electrical Engineering Portal.
-
It often becomes visible at higher voltages, especially under nighttime or low-light conditions wazipoint.com.
2. What Causes Corona?
-
When the field gradient at the conductor surface exceeds ~30 kV/cm (at sea level), air ionization begins, leading to corona discharge Wikipedia+1.
-
Sharp or irregular conductor surfaces intensify field stress, making corona more likely. This is why smooth, polished conductors or corona rings are often used to mitigate the effect Wikipedia.
3. Associated Effects
-
Audible noise: The ionization process generates small pressure waves, heard as hissing or crackling, especially in wet weather EEP - Electrical Engineering Portal.
-
Ozone and NOₓ formation: Ionization leads to dissociation of oxygen and nitrogen molecules, producing ozone and nitrogen oxides, which can be corrosive EEP - Electrical Engineering Portal.
-
Electromagnetic interference (EMI): The corona-generated current pulses inject noise into nearby communication systems EEP - Electrical Engineering Portal.
4. Engineering Countermeasures
-
Increase conductor diameter: Reduces electric field intensity.
-
Use bundled conductors: Spread the field over a larger area.
-
Apply corona rings or grading rings: These rings help smoothen the electric field gradient, lowering the chance of ionization Wikipedia.
-
Maintain conductor surface: Clean and smooth surfaces resist corona initiation.
🔹 Conclusion
The corona effect is an inevitable phenomenon in EHV (Extra High Voltage) transmission lines, but its impact on efficiency, noise, and interference must be carefully minimized through design. Engineering solutions such as increasing conductor size, using bundled conductors, maintaining proper spacing, and ensuring smooth surfaces are essential for reliable and economic power transmission.
Saturday, September 27, 2014
Induction Motors Torque Equation; Torque equation
Torque Equation of Induction Motor: Explained with Factors Affecting Speed-Torque Characteristics
Induction motors are widely used in industries due to their robustness, low cost, and simple construction. One of the most important aspects of analyzing an induction motor is its torque equation, which helps in understanding how the motor develops torque under different operating conditions.
Torque Equation of an Induction Motor
The general torque equation of an induction motor is:
Where:
-
T = Torque developed
-
V = Applied stator voltage per phase
-
R1 = Stator resistance
-
R2’ = Rotor resistance (referred to stator side)
-
X1 = Stator reactance
-
X2’ = Rotor reactance (referred to stator side)
-
s = Slip
-
ωs = Synchronous angular speed
Key Relation: Torque is Proportional to Voltage Squared
From the above equation, we see:
This means the torque developed is directly proportional to the square of the applied voltage. Even a small reduction in supply voltage leads to a significant drop in torque, which is crucial for applications requiring high starting torque.
Factors Affecting Speed-Torque Characteristics of Induction Motor
The speed-torque characteristics of an induction motor are influenced by several parameters:
(a) Applied Voltage
-
Torque is proportional to .
-
Reduction in voltage decreases both starting torque and running torque.
-
Motors may fail to start under reduced voltage conditions in heavy-load applications.
(b) Supply Frequency
-
Increase in supply frequency reduces starting torque.
-
Higher frequency increases synchronous speed (), shifting the torque-speed curve.
-
Motors designed for fixed frequency (50 Hz/60 Hz) must not be operated at significantly higher frequencies.
(c) Rotor Resistance ()
-
The maximum torque (Tmax) is independent of rotor resistance.
-
Increasing rotor resistance:
-
Improves starting torque.
-
Shifts the slip at which Tmax occurs to a higher value (lower motor speed).
-
-
Useful in wound rotor induction motors for controlled starting.
Practical Implications
-
Industrial Applications: Motors with high starting torque (e.g., cranes, hoists) may use external rotor resistance for better performance.
-
Energy Efficiency: Voltage drops in long transmission lines can drastically affect induction motor torque.
-
Variable Frequency Drives (VFDs): Allow frequency and voltage control to optimize speed-torque characteristics.
✅ Summary:
-
Torque in induction motors is directly proportional to the square of voltage.
-
Supply voltage, frequency, and rotor resistance significantly affect the speed-torque curve.
-
Understanding these factors helps in motor selection, efficiency improvement, and troubleshooting in industrial applications.
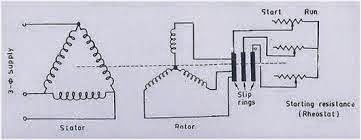
Slip Ring induction motors starting; Slip ring induction motor starter
What Happens If Electricity Frequency Increases from 50 Hz to 60 Hz?
1. What does 50 Hz vs 60 Hz actually mean? At 50 Hz, 50 electrical cycles occur every second. At 60 Hz, 60 cycles occur every second. ...
-
Tan Delta Test (Loss Angle Test / Dissipation Factor Test) The Tan Delta Test is also known as the loss angle test or dissipation fact...
-
⚡ The Ultimate Guide to Number of Discs Required for Very High Voltages and Selection Methods Introduction In modern power transmissi...
-
🏗 ️ Technical Specification of Aluminium Cables (IS 7098: Part 1 – 1988) When specifying aluminium cables, you will often come acros...